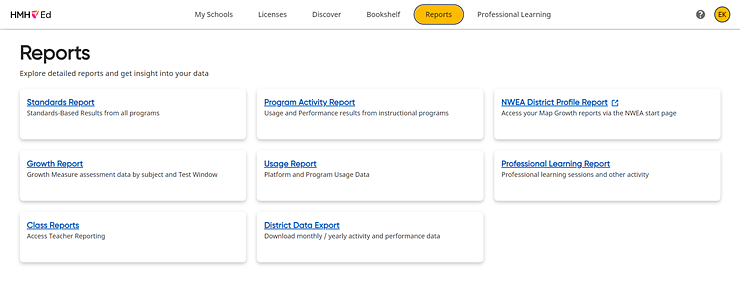
District and school administrators can view Professional Learning Reports, which includes the following report options:
● Coachly Reports – (if available) allows you to track individual teacher's Coachly session attendance and session totals over time
● Pathways Reports – allows you to track individual teacher's status and progress in the Success Pathways in which the teacher is enrolled
● Coaching Reports – allows you to view coaching services that have been purchased and the usage of the services to date
1. In the banner, click the Reports tab, and on the Report page, click the Professional Learning Reports card.

The page offers three report tab options: Coachly, Pathways, and Coaching.
2. In the School Name list, select a school from the list of schools in your district or retain the default All Schools option. (This list is available to district administrators only)
3. To view the Coachly Report, select the Coachly tab. (If your organization has Coachly, this report tab appears by default when the Professional Learning Report option is selected from the Report list.)
Note: The session activity for teachers is captured every day, and the Coachly Leadership reports update every evening.
The Coachly Report has two subtabs—Session Attendance and Sessions Over Time.
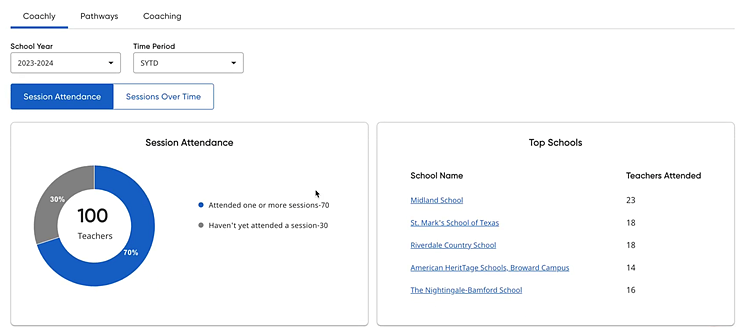
– Session Attendance
The Session Attendance subtab has three main components, described as follows:
○ Overall Session Attendance – This area categorizes teachers into those who have attended one or more sessions with a coach and those who have not attended a session with a coach yet. These are counts based on the selected school year and time period; the default is the current school year and “SYTD” (school year to date). Note that the school year begins ~July 1st and ends ~June 30th.
➔ If needed, use the School Year and Time Period lists above the report to change the selections:
○ Top Schools – This component displays the top five schools, based on the count of teachers attending sessions with coaches for the selected time period.
➔ Click a school name to view the Teacher List report for that school.
○ Teacher List – This report provides a table showing each teacher’s coaching activity for the selected school. The table provides the following for each teacher listed: Teacher Name (First Last), School Name, Coach Name, Time Coached, and Program.
➔ Click any table header to sort the table according to that column. (Some of the columns do not offer a sorting option.)

➔ Click the arrow beside a teacher's name to view additional details for the sessions that the teacher attended, including the program and time details.

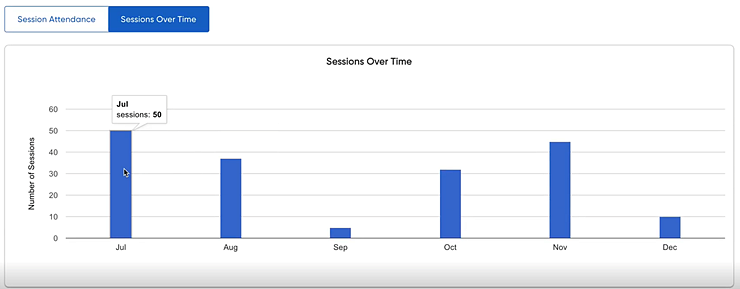
– Sessions Over Time
The Sessions Over Time subtab shows the month-by-month totals for the district or a selected school. Monthly counts are also available.
➔ Hover over one of the month bar graphs to see the total number of sessions for that month
4. To view the Pathways Report, select the Pathways tab. (If your organization does not have Coachly, this report tab appears by default when the Professional Learning Report option is selected from the Report list.)
Before report filters are selected, district administrators see the Pathway Report for all schools and teachers in their district. School administrators see the Pathway Report for all teachers listed in their school.
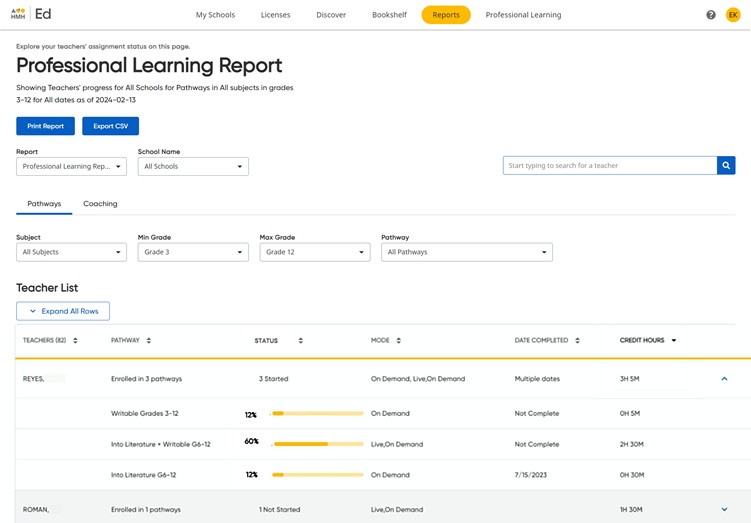
a. If needed, use the lists above the report to filter selections and change the data displayed in the report, as follows:

○ In the Search Teacher field, type all or part of a teacher's name and then select the teacher from the list.
○ In the Subject list, select a subject.
○ In the Min Grade/ Max Grade list, specify a grade range by selecting the lowest and highest grade level to view.
○ In the Pathway list, select a Teacher Success Pathway.
The Pathway Report updates to display the data that matches the filter criteria you selected.
b. Note the following columns are included in the table of the Pathway Report:
○ Teachers – lists the teacher names in alphabetical order based on the selected filters.
○ Pathway – states the count of Pathways each teacher is enrolled in; when the teacher's details are expanded (using the arrow at the end of the row), the name of Pathways are shown.
○ Status – states the number started and not started in the summary and then when expanded for the details, the percent completed based on the topics completed over the total topics in each Pathway.
○ Mode – represents the different ways a teacher can complete a Topic, which may be Live or On Demand; note that On Demand is when the teacher accesses the Pathway and Topic through their teacher login on Ed and works through the Topic using the online Pathway.
○ Date Completed – states the date(s) the Pathway is completed; shows NA when none have been completed.
○ Credit Hours – shows the hours earned for each completed topic; in the Summary row, all credit hours across each Pathway are added and when the teacher's details are expanded (using the arrow at the end of the row), the credit hours per Pathway are displayed.
Note: All of the table columns can be sorted using the arrows in the column headers.
c. Print or export the Pathways Report, as follows:
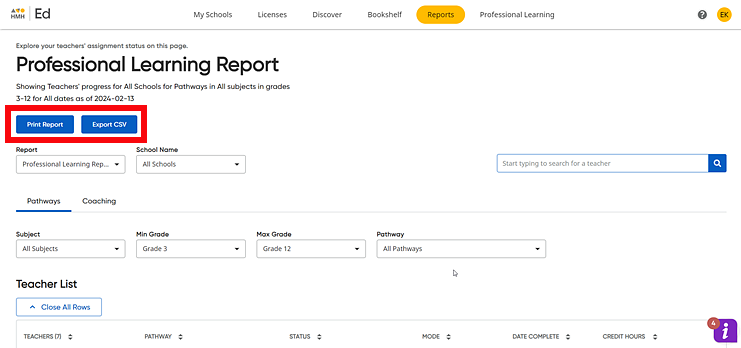
○ Click the Print Report button to create a PDF version of the report.
○ Click the Export CSV button to create a CSV file, and then follow your browser's prompts to open or save the CSV export file.
The exported CSV file includes all results and not only those on screen. Note that the teacher name is duplicated for the summary row and for each enrolled Pathway for ease of analytics and filtering.
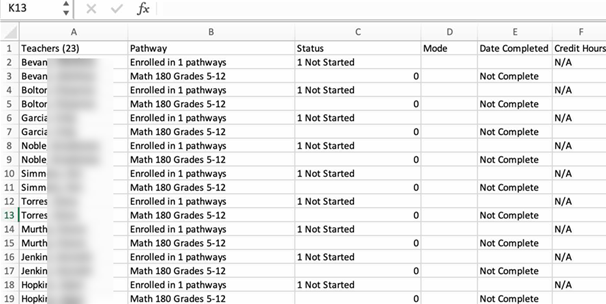
5. To view the Coaching Report, select the Coaching tab. The Coaching Report appears showing a pie chart followed by a table.
Note: The Coaching Report includes events dates starting July 1, 2023 only.
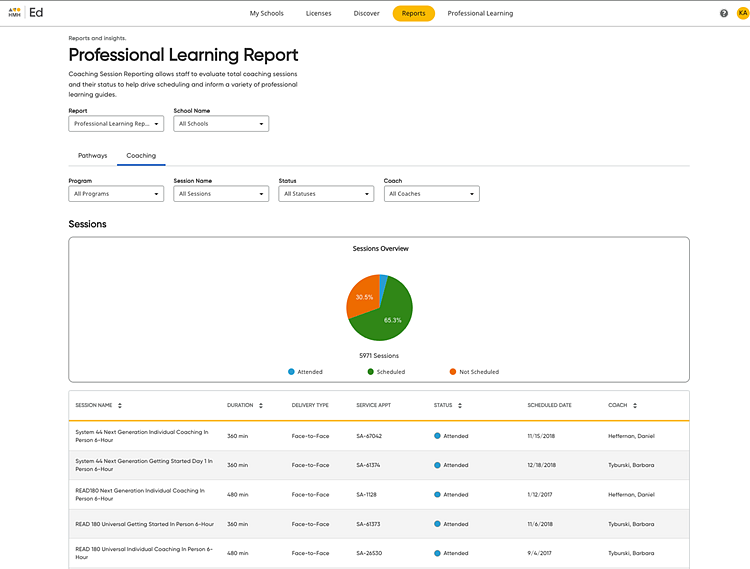
The Sessions Overview pie chart provides a summary of the services that have been attended, scheduled, and not yet scheduled. The table provides coaching services details, including the following columns: Session Name, Duration, Delivery Type, Service Appointment, Status, Schedule Date, and Coach.
Note: All of the table columns can be sorted using the arrows in the column headers.
➔ If needed, use the lists above the report to filter selections and change the data displayed in the report, as follows:

○ In the Program field, select a program from the list.
○ In the Session Name list, select a session name from the list of sessions purchased by your district/school.
○ In the Status list, select the status of the coaching session.
○ In the Coach list, type all or part of a coach's name and then select the coach from the list.
The Coaching Report updates to display the data that matches the filter criteria you selected.