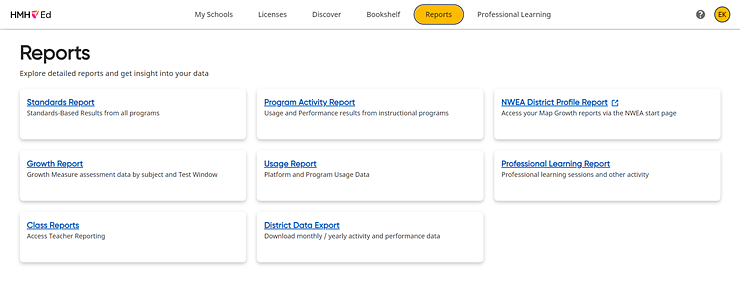
The Administrator Program Activity Report (PAR) is available for Math 180, Read 180, and Waggle in the HMH Ed™ Reports tab.
The Math 180/Read 180 Student Application delivers critical usage data that is tracked by all levels of educators supporting students through their use of Math 180 and Read 180. For Math 180, performance data is also available. These data include topic/segments and lessons/sessions completed (often used for gradebook workflows by teachers and leaders to monitor implementation efficacy) as well as session and time in the application. These data are then aggregated up across all class and schools to deliver averages across all metrics. Leaders can also drill all the way to student details when needed.
1. In the banner, click the Reports tab, and on the Report page, click the Program Activity Report card.

The Program Activity Report page appears and opens to the All Schools report for your district.

2. Use the lists above the report to filter selections and change the data displayed in the report, as follows:

– In the Program list, select the program you want to view—Math 180, Read 180, or Waggle.
The Component list defaults to Student Application.
– In the School list, select a school from the list of schools in your district. (Available for district administrators only)
– In the Student Grades list, select a grade level.
The School Year for the report defaults to the current school year; the Time Period 1 defaults to Last 30 Days, and Time Period 2 defaults to School Year to Date.
– To change the school year and periods for the report, do the following:
a. Click the More Filters button. A Filters dialog box appears with School Year and Time Period lists.

b. Select the time periods from the lists provided, and then click Apply. The report updates to reflect your selected filters.
Note: The Applied filters section lists the selected school year/time period filters for the report. You can remove an applied filter by clicking the X for that filter, and you can remove all the filters and return to the defaults by clicking the Reset all filters option.

The Program Activity Report includes these major sections:
– District Usage: Key Performance Indicators (KPIs)
– School/Student Grade Tables
Details for these sections are provided in the steps that follow.
3. Note the following details about the District Usage: Key Performance Indicator (KPI) section of the report:
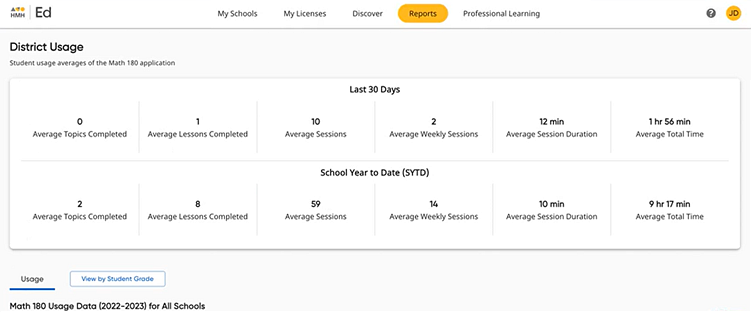
– The KPIs (shown in the top section of the report) highlight the district’s overall usage data from the Student Application.
– The data is per student averages, which differs from the Teacher Class and Student Reports, which are counts. Counts or totals across an entire district are not meaningful; as such, the district report shows the data as per student averages because many district and school staff have usage goals that can be easily gleaned from the KPI dashboard.
– These data are topics completed, lessons completed, sessions, weekly sessions, the average duration of the sessions in minutes and total time in the student application in hours and minutes.
– These data are then displayed (by default) for the last 30 days and then compared to the school year to date (SYTD). The time periods can be changed using the More Filters option as detailed in Step 2.
4. Scroll down the page to the lower section of the report to view the Schools/Student Grade Tables for the class. These tables shows the class data with various options that differ depending on the selected program, as follows:
– Usage Tab – shows the Usage table, which defaults to School view, showing all the schools with any Math 180/Read 180 Student Application usage (defined by at least one student in a class launched Math 180/Read 180 from Ed that then is recorded as a session for that student, in a class with the Lead Teacher name included). The table report then mirrors the Usage KPI for each main data element.
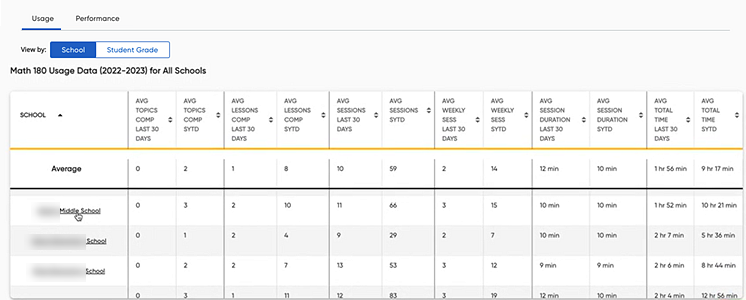
 For
descriptions of the columns within this table, click here:
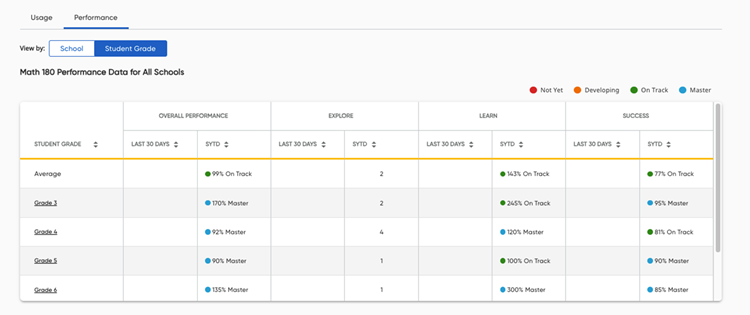
– Performance Tab (Math 180 only) – shows the Math 180 Student Application Performance table, which loads the Overall Performance column, then Performance Zones that include Explore, Learn, and Success columns. These columns are broken down into two time periods, which may be customized using More Filters tool (see Step 2a above); the default time periods are Last 30 Days and SYTD (School Year to Date). These data are then aggregated up across all class and schools to deliver averages across all metrics. Administrators can also drill all the way to student details when needed.
Math 180 Student Table – Performance Tab
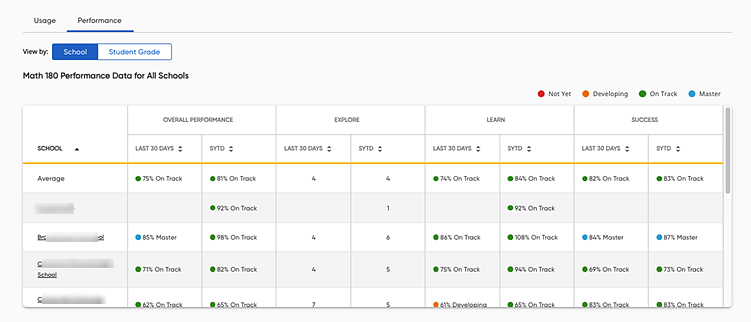
The table report
then shows the Performance data for each main zone element;  for
details, click here:
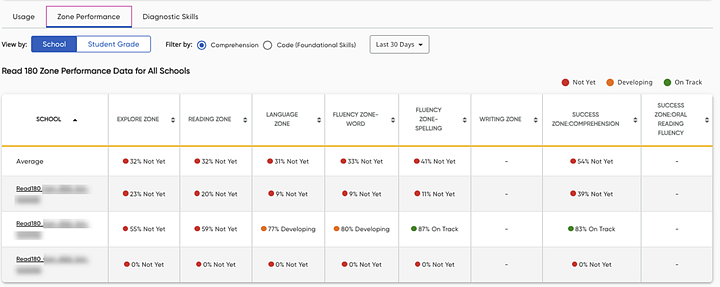
– Read 180 Zone Performance Tab (Read 180 only) – offers more precise score data showing how schools and students are scoring in specific zones in both Comprehension and Code segments. You can view zone performance data found in the teacher reports as well as how students across the district or school are scoring in each zone.
You can view by school or student grade using the subtabs, and by Comprehension or Code segments using the option buttons. You can also drill down from the district-level data to view school, teacher, and grade views.
Read 180 Student Table – Zone Performance Tab
– Read 180 Diagnostic Skills Tab (Read 180 only) – shows data found in the teacher Program Activity Report and also how students across the district are scoring on subskills within Comprehension, Foundational Skills, and Vocabulary segments. (The Code Placement Assessment will be included in future updates.)
Read 180 Student Table – Diagnostic Skills Tab
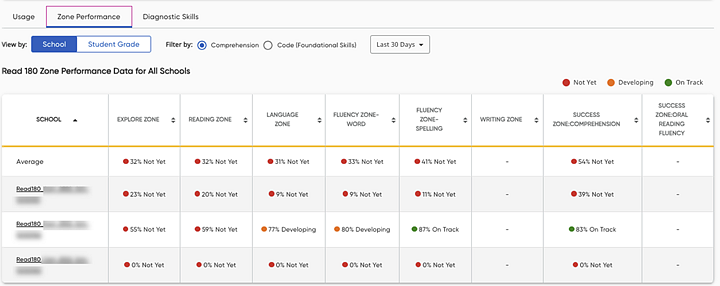
To filter by subskill, click the appropriate button. You can also use the date list to filter by date or drill down from the district level data into school, teacher, and grade views.
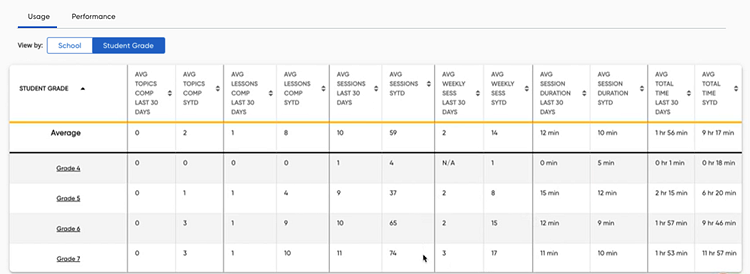
5. Select the Student Grade button above the table to view the report broken down by grade level.
– For the Usage tab, the report updates to display the Student Grade Usage Report for the district, which shows the aggregated usage data broken down by grade.
– For the Performance/Zone Performance tab, the report updates to show the aggregated performance data of all students broken down by grade.
– Within any tab of the Student Grade view table, click a grade level to view to student count for that grade level. A dialog box appears displaying the number of students with activity that are currently enrolled in the selected grade level with two time period options.
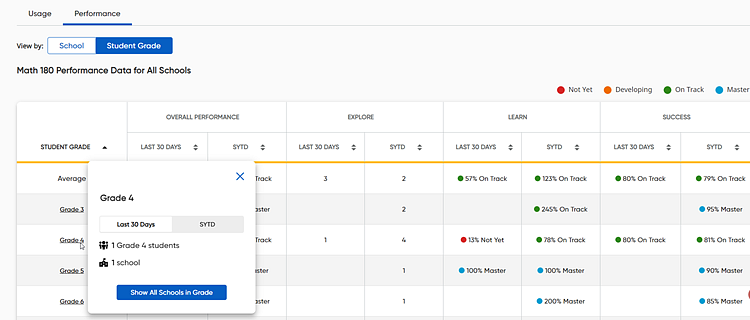
– Click the time period buttons to toggle between the two time periods. The default time periods are Last 30 Days and SYTD (School Year to Date); you can customize the time periods using More Filters tool.
– Within this dialog box, click Show All Schools in Grade button to view the report for the selected grade level.
Note: You can change the table back to the school view by clicking the School button at the top of the table.
6. Within the school view of the table, drill down within any tab to view more detailed reports, as follows:
– Click a school name to view the student count for the school. A dialog box appears displaying the number of students with activity that are currently enrolled in the selected school with two time period options.
– Click the time period buttons to toggle between the two time periods. The default time periods are Last 30 Days and SYTD (School Year to Date); you can customize the time periods using More Filters tool.
– Within this dialog box, click Show Teacher Data button to view the report by teacher.
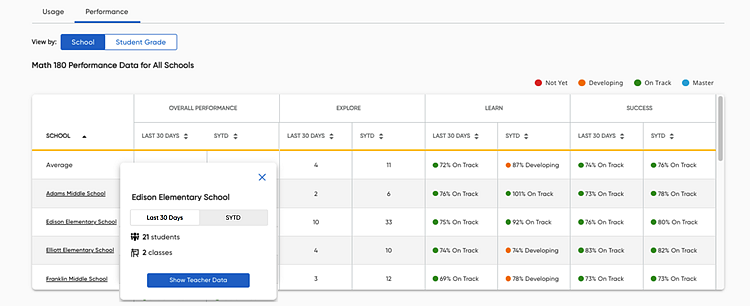
The teacher-level report displays data for each teacher in the selected school.
7. Within the teacher-level report, drill down within any tab to view more detailed reports, as follows:
– Click a teacher name to view the student count for the teacher. A dialog box appears displaying the number of students with activity that are currently associated with the selected teacher with two time period options.
– Click the time period buttons to toggle between the two time periods. The default time periods are Last 30 Days and SYTD (School Year to Date); you can customize the time periods using More Filters tool.
– Within this dialog box, click Show Student Data to view the teacher's class report.
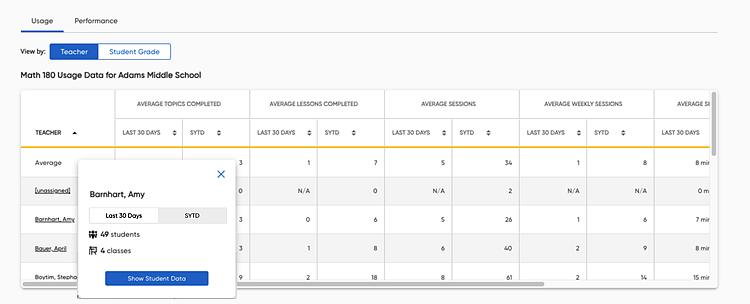
The teacher's class-level report appears, allowing you to select classes and drill down to the student-level reports.
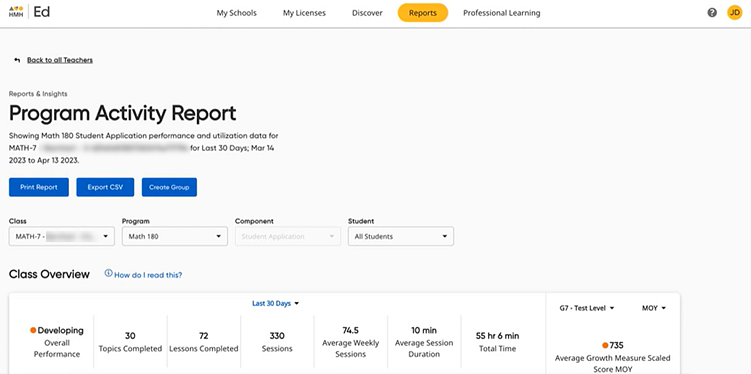
See Navigate the (Teacher)
Program Activity Report Page ![]() or Open (Teacher) Program Activity Reports
or Open (Teacher) Program Activity Reports
![]() in Ed Teacher Help for details.
in Ed Teacher Help for details.
Note: Currently,
the time spent being tracked for each student’s Math 180 session does
not include the time spent watching the Anchor Video or time spent interacting
with the Simulations. Learn Zone and Success Zone are the primary contributors
to the time spent and session duration data.
Math 180’s program assessments are called
mSkills. These online assessments are assigned by the teacher often after
a Block is completed. The results flow into the Teacher Standards and
Assessments reports.
➔ To return to the District-level Teacher Usage report, click the Back to all Teachers link at the top of the page.
The data in the Program Activity Report can be printed and/or exported as a comma separated value (CSV) file. The printed or exported report is based on the filters applied on the report table for all programs.
8. Print or export the report, as follows:
– Click the Print button to create a PDF version of the report.
– Click the Export to CSV button to create a CSV file, and then follow your browser's prompts to open or save the CSV export file.
See Also:
Waggle Program Activity Report
![]() in Waggle Administrator Help
in Waggle Administrator Help