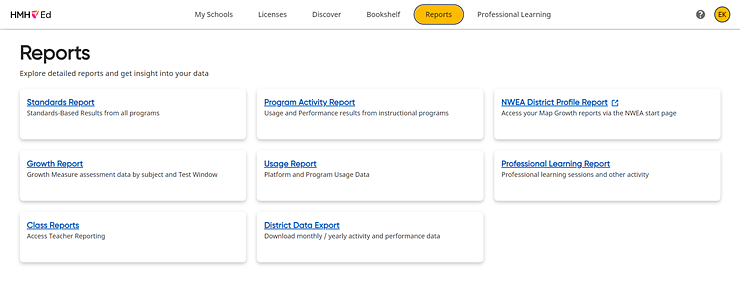
Note: The Usage Report is not available to all users. If you do not see the Usage Report option available in your Report list, then the option is not available for your organization.
HMH Ed™ offers a set of reporting dashboards for district and school administrators. These Usage Reports provide administrators with several metrics to help evaluate platform and program usage.
1. In the banner, click the Reports tab, and on the Reports page, select Usage Report card.

The Usage Report page appears defaulted to the Platform Usage–Total Logins by Role page.
2. Use the lists above the report to filter selections and change the data displayed in the report; the lists include: School Groups, School Name, Roles, and Student Grades.

3. Use the tabs above the report to select the type of usage data report displayed.

The tab options are Platform Usage, Program Usage, and Learning Profile. See the following steps (steps 4–6) for details for each of these tabs.
4. Select the Platform Usage tab to view various metrics detailing the usage of the platform, as follows:
Platform Usage tab – provides administrators with four platform login derived metrics, all of which represent a week’s worth of data updated each weekend. Each metric displays information by role about logins to the HMH Ed platform.
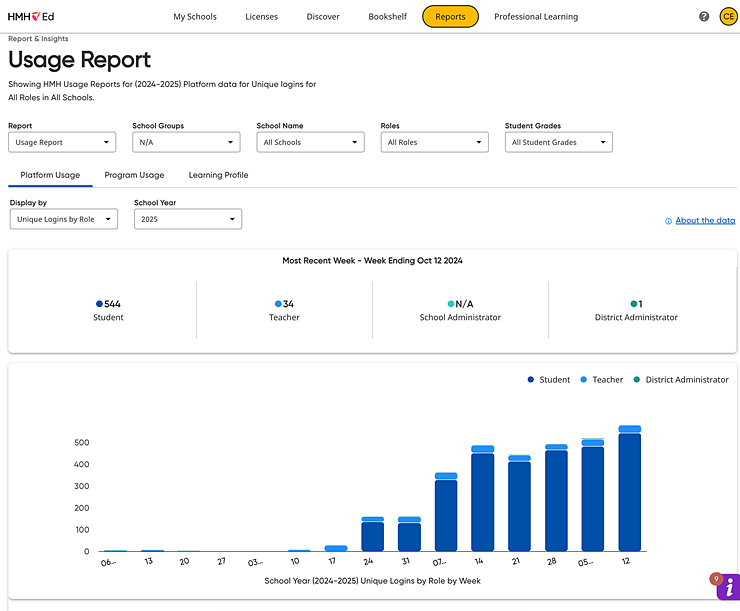
– Use the Display by list to select from the following four metric options:
○ Total Logins – the number of times a user logged in during the week.
Example: For a teacher who logs in three times on Monday, two times on Wednesday, and once Friday, the total logins reported for that teacher is six.
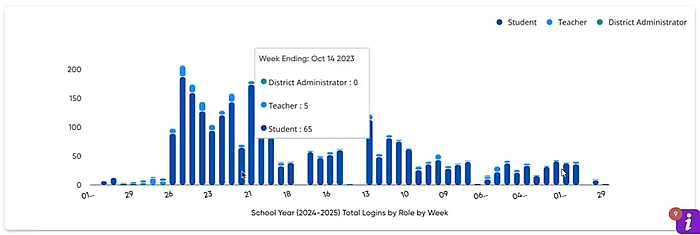
Note: Within the bar charts, you can display further details by hovering or clicking over any bar.
○ Unique Logins – the number of unique users that login during the week. This can help you determine if all users who should log in, do log in.
Example: A student logs in multiple times on Monday, Tuesday, and Friday in a single week. For that week, the report shows one unique user in our count.
○ Average Logins – the ratio between total number of logins and unique logins. This metric can help you determine if users are logging in as often as they should. Users who did not log in this week are excluded from this metric.
○ Sustained Usage – provides a view of cumulative user login patterns by week with three categories of usage—Low, Medium, and High. These categories of usage can then be viewed through the lens of Week Thresholds. Applying different Week Thresholds to the three categories of usage allows leaders to gauge if there are improvements needed to encourage more frequent usage.
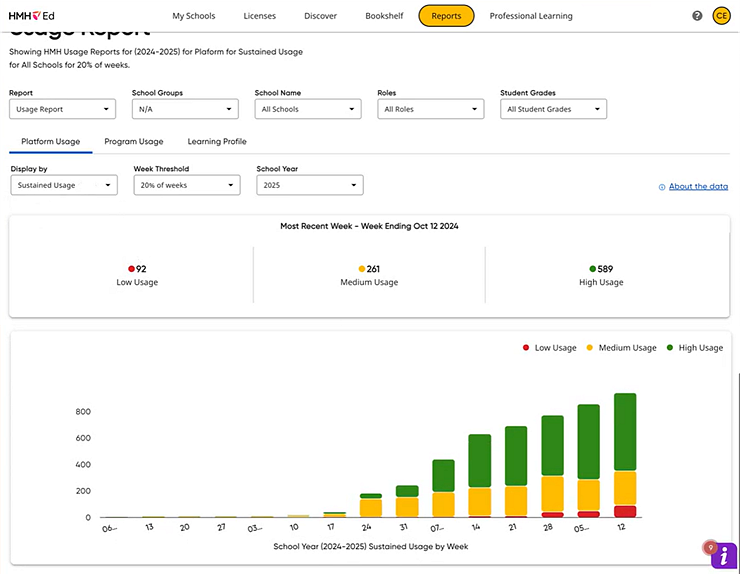
The Sustained Usage values are cumulative each week. Administrators choose one of these thresholds—20%, 40%, 60%, or 80%. If, for example, a district administrator chooses 40%, then all users with at least one login this school year are binned into one of three categories, as follows:
High – These users have had at least two logins in at least 40% of the weeks since their first login of the school year.
Medium – These users have had at least one login this school year for at least 40% of the weeks since their first login of the school year but have not had at least two logins in at least 40% of those weeks.
Low – These users have not had at least one login for at least 40% of the weeks since their first login of the school year.
For any week, the total number of users with logins to date will not change when the dashboard user changes their choice of threshold percentage. However, the binning will change. For example, if the dashboard user changes their threshold from 40% to 80%, the number of users in the High sustained usage category will decrease and the number of users in the Low sustained usage category will increase.
– Use the School Year list to select the school year for which to compare weekly data. School years include data from July to June. By selecting a year, such as "2025," you will see the week-by-week comparison of the selected 2025 school year (ending in June 2025) to the prior school year (2024), which includes all 52 weeks (July 2023 through June 2024) in that school year. The School Year selection is available in both the Platform and Program tabs.
5. Select the Program Usage tab to view information about the usage of programs, as follows:
Program Use tab – Provides administrators with information about the use of specific programs on the Ed platform. Note that programs on the Ed Platform have different actions that are tracked to create a program user. This normalized metric allows leaders (curriculum coordinator, interventionists, and so on) to evaluate the extent of usage they are seeing each week and how that compares to their expected implementation and usage goals.
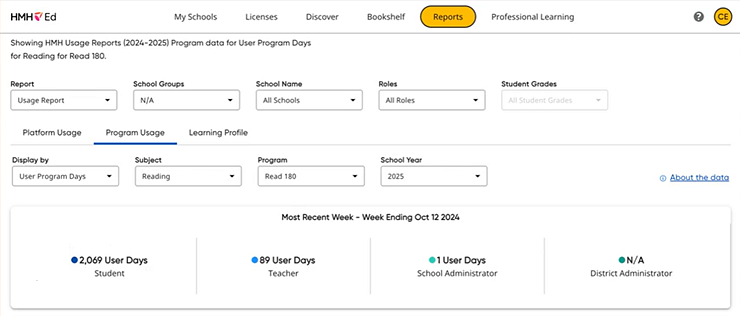
– Use the Display by list to select from the following two options:
○ Program User Days – This is a metric that allows leaders to evaluate program usage through the lens of the expected implementation and utilization model. This metric is best reviewed be selecting a specific program, given that usage expectations vary based on the program’s pedagogy and intent.
One program user day is counted when a user does at least one thing in a program in a day. If more than one program is selected and a user had activity in more than one program in a day, the report counts that as more than one program user day. This metric varies according to the number of programs selected and activity in these programs. For example, if you selected two programs on the dashboard and a user performed actions in both, that counts as two program user days.
○ Unique Users with Program Activity – This allows staff to determine if the expected or eligible users are using the programs regardless of the frequency of use each week. Simply stated, this is the count of all users who did at least one thing in a program in that week. If more than one program is selected (in the dashboard) and a user had activity in more than one program that week, that counts as more than one unique user with program activity. Because two programs are selected and a user had activity in both programs in a day, the report counts that as two unique users with program activity.
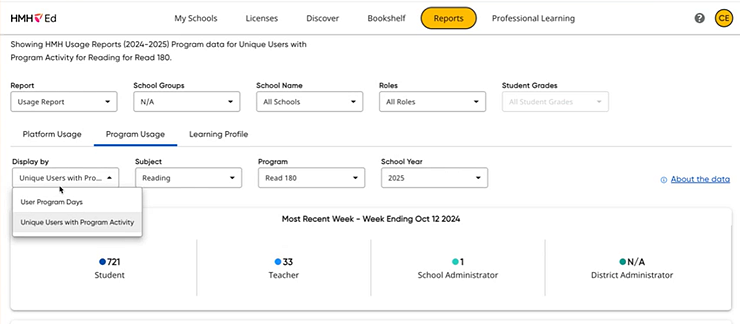
– Use the Subject list to select a subject.
– Use the Program list to select a program.
– Use the School Year list to select the school year for which to compare weekly data. School years include data from July to June. By selecting a year, such as "2025," you will see the week-by-week comparison of the selected 2025 school year (ending in June 2025) to the prior school year (2024), which includes all 52 weeks (July 2023 through June 2024) in that school year. The School Year selection is available in both the Platform and Program tabs.
6. Select the Learning Profile tab to view information about the usage of programs, as follows:
Learning Profile tab – Uses state assessment data to group students into five estimated Grade Level Equivalency (GLE) categories for each district, school grouping, and school. The data may be filtered by common test levels like Math Grade 3 or Algebra 1.
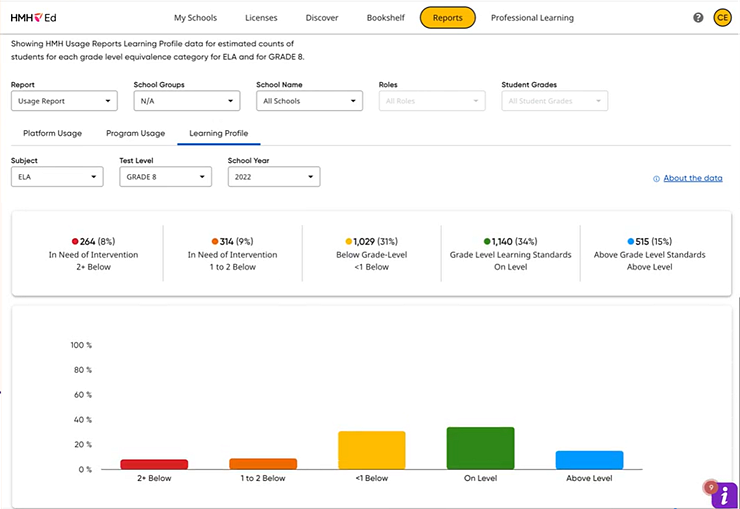
– Use the Subject list to select a subject.
– Use the Test Level list to select a program.
– Use the School Year list to select the school year for which to view test results.