MAP Growth reports show class and student results from NWEA MAP assessments.
Note: ● If your organization does not have access to any of the growth measure learning programs, such as Into Reading, Into Literature, Into Math, Into AGA, Math in Focus, ¡Arriba la Lectura!, Waggle, Math 180, or Read 180, then the growth reports are not available to you. ● The examples and details in this topic apply to NWEA MAP Growth Reading and Math reports only. |
You can view the growth assessments report for the class (all students) or for an individual student. Both are described below.
➔ To move down the page and view the details of a specific report type, click one of the following report-type links:
● Growth Reports for All Students
● Growth Reports for an Individual Student
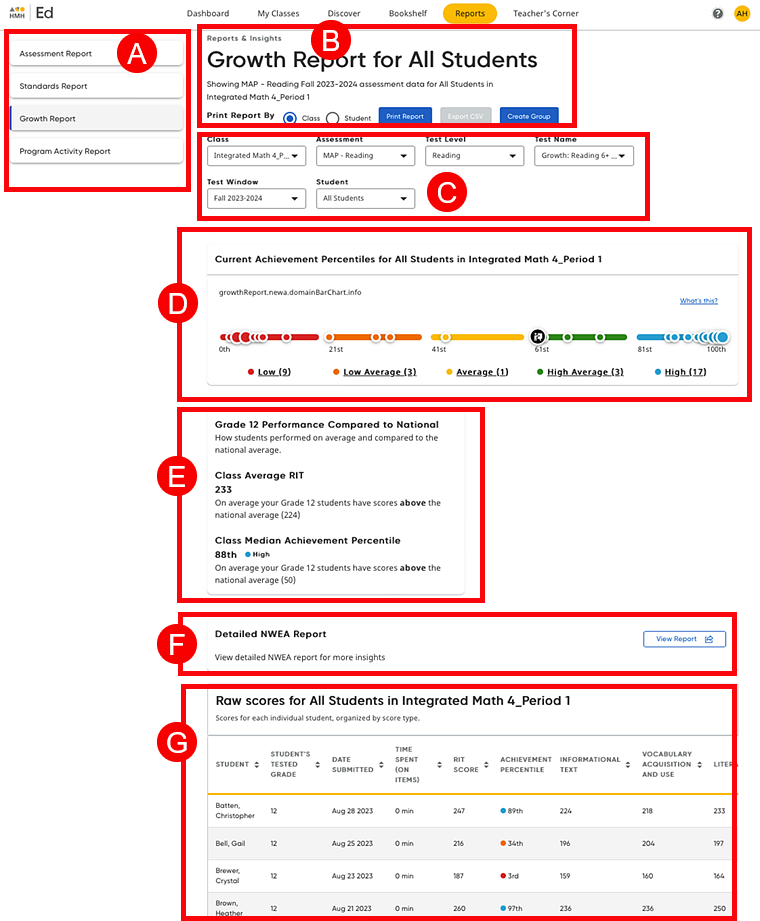
➔ Click a letter or outlined area to view the Growth Reports for All Students page details.

Report Links |
||
Report Links – Allows you to select the report type to view |
||
Report Information, Print Report By Options, Print Report Button, Export CSV Button, and Create Group |
||
|
● Details about the selected report are displayed, including the student name, assessment title, and test name. ● The Print Report button allows you to print the selected report or save the report as a PDF. This option can be used for class reports or individual student reports; the student option allows you to select one, multiple, or all students in the class to print individual reports for each selected student. (See Print or Export Growth Reports for details.) ● The Export CSV button allows you to export the data in the table of the class report as a comma separated value (CSV) file. (See Print or Export Growth Reports for details.) ● The
Create Group button allows
you to create a group of the students listed in various performance
levels. The Create Groups page displays the other students in the class and allows you to create additional groups. For details about renaming and managing groups, see Edit Groups. |
|
Class, Assessment, Test Level, Test Window, Test Name, and Student Lists |
||
|
These lists allow you to select filters to view the desired report, as follows: ● Class – Select the class for which to view the MAP growth report. ● Assessment – Select the specific assessment.
● Test Level – Select a test level for which to view the MAP growth report. ● Test Window – Select the test window of the MAP growth report you want to see.
● Test Name– Select the test name. ● Student – Select the entire class (All students) or an individual student for which to view the growth report. |
|
 |
Current Achievement Percentiles Scatter Plot |
|
|
Class Performance Scatter Plot – Displays color bands, each representing proficiency score ranges for the test and data points, each representing the score of a student on the most recent test
Note: – The
class average score is represented on the graph by the large black
and white node – If a student has no data for the most recent test, then that student does not appear on the graphs or lists.
➔ Click a node to view the test score for each student or click a color band link (below the graph) to view the list of students whose scores fall within that score range. |
|
 |
Compare to Averages |
|
|
|
This area of the report provides the following: – Class Performance Compared to National – Class Average RIT – Class Median Achievement Percentile
This component repeats for each student grade level in the class. For example, if there are 6th and 7th graders who took the same MAP Growth Assessment (in the same term), then this includes a Median Achievement Percentile Component for the 6th graders and 7th graders. |
Detailed NWEA Report |
||
|
This section offers a link to your full report on the NWEA platform.
➔ Click the View Report button to view the complete NWEA report. This opens your NWEA platform in a separate browser window.
See MAP Help Center:
Start Page Overview
|
|
Raw Scores Table |
||
This area provides all the class test results in a table format. The first table displayed is the most recent test; if previous tests are available, you can select another test to view. For each student in the class, the table includes the student's tested grade level, date the test was submitted, time spent taking the test, RIT Score, achievement percentile, and more.
➔ Click a table header to sort the table according to that column. (Some of the columns do not offer a sorting option.) Note: Each MAP Growth Report can have up to three tests in a school year.
The NWEA MAP growth scores include the following: – Subject RIT Scores – Instructional Area RIT Scores – Achievement Percentiles – Achievement Levels/Bands – Lexile/Quantile Ranges |
||
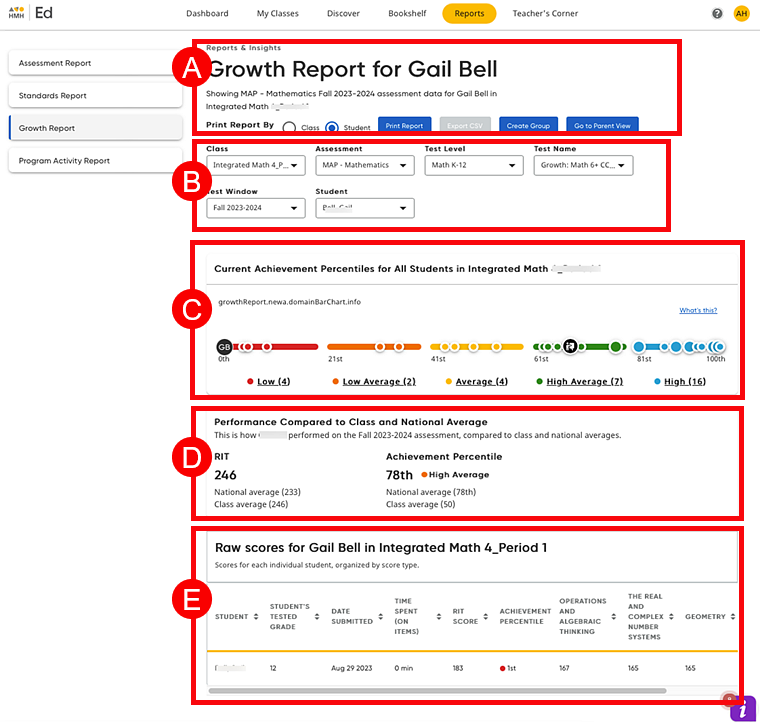
➔ Click a letter or outlined area to view the Growth Reports for Student page details.

Report Information, Print By Options, Print Report Button, Export CSV Button, Parent View Button, and Create Group |
|
● Details about the selected report are displayed, including the student name, assessment title, and test name. ● The Print Report button allows you to print the selected report or save the report as a PDF. This option can be used for class reports or individual student reports; the student option allows you to select one, multiple, or all students in the class to print individual reports for each selected student. (See Print or Export Growth Reports for details.) ● The Export CSV button allows you to export the data in the table of the class report as a comma separated value (CSV) file. (See Print or Export Growth Reports for details.) ● The Go to Parent View button to allows you to view the student report with the class comparison data removed. This provides a report with only the selected student's data displayed, which allows you to save or print a report that is appropriate to share with parents. ➔ To return to the individual student report with class comparisons displayed, click the Teacher View button. |
|
Class, Assessment, Test Level, Test Window, Test Name, and Student Lists |
|
|
These lists allow you to select filters to view the desired report, as follows: ● Class – Select the class for which to view the MAP growth report. ● Assessment – Select the specific assessment.
● Test Level – Select a test level for which to view the MAP growth report. ● Test Window – Select the test window of the MAP growth report you want to see.
● Test Name– Select the test name. |
Current Achievement Percentiles Scatter Plot |
|
|
This scatter plot displays color bands, each representing proficiency score ranges for the test and data points, each representing the score of a student on the most recent test. ➔ Click a node to view the test score for each student or click a color band link (below the graph) to view the list of students whose scores fall within that score range.
Note: – The
selected student is represented on the graph by a node with the
student's initials – The
class average score is represented on the graph by the large black
and white node – If a student has no data for the most recent test, then that student does not appear on the graphs or lists. |
Compare to Averages |
|
|
In the Compare to Averages section, view the student's RIT and Achievement Percentile scores compared to class and national averages.
|
Raw Scores Table |
|
|
The table shows the student's test results for all the test events for the school year and includes the student's tested grade level, date the test was submitted, time spent taking the test, RIT Score, achievement percentile, and more.
Note: Each Growth Report can have up to three tests in a school year. |
See Also: