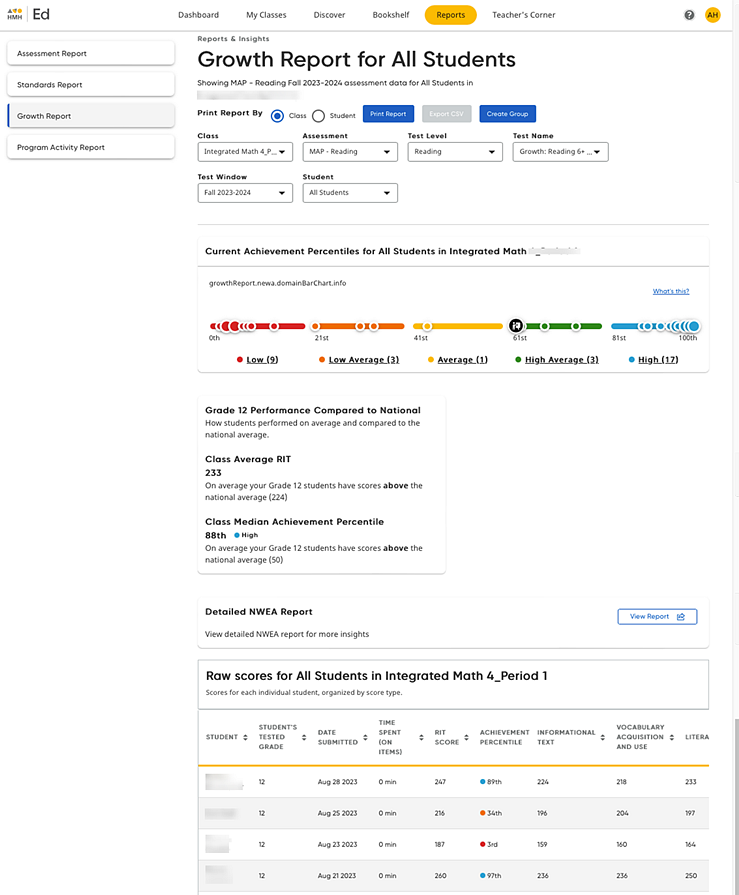
If you are one of the select users whose district uses Common Rostering and you have access to both HMH Ed™ and NWEA MAP platforms, then MAP Growth assessment data may appear in the Growth Report in Ed allowing you to view that data to inform instruction within the Ed platform.
1. Do either of the following:
– In the Your Messages area of the Dashboard, locate the Growth Report Update message for the MAP growth report you want to open and click View Report.
Note: This message appears on your Dashboard when at least one student has completed an assigned MAP growth assessment.
Or
– In the banner, click the Reports tab, and then in the left panel of the page, click Growth Report. The Growth Report page appears. By default, the report shows the MAP class report (All Students) for the most recent test in the selected subject.
Note: The report page is blank until at least one student in the selected class has completed the MAP growth assessment.

Note: The
Create Group button at the top
of the page allows you to create a group of the students listed in various
performance levels.  Click
to view example of Create Groups page.
The Create Groups page displays the other students in the class and allows
you to create additional groups. For details about renaming and managing
groups, see Edit Groups.
2. Above the report graphs, use the lists provided to select the report that you want to view, as follows:
– In the Class list, select the class.
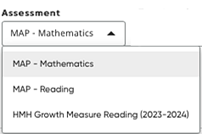
– In the Assessment list, select the test title.
– In the Test Level list, select another level of the test (if available).
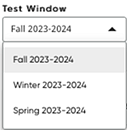
– In the Test Window list, select the test window of the test (Fall, Winter, Spring).
– In the Test Name list, select the test name.
– In the Student list, select an individual student for which to view the report. (Skip to step 5 for details.)
3. On the Growth Report for All Students (class report), note the four areas of the report.
– In the Current Achievement Percentiles for All Students scatter plot, do any of the following:
○ Note
the average class score, which is indicated by the large black and white
node ![]() .
.
○ Click a color band link (below the graph) to view a dialog box listing the students whose scores fall within that score range; the test score for each student is also displayed.

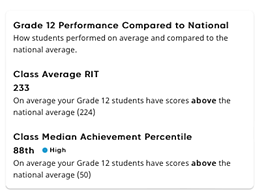
– The Compare to Averages section of the report provides the following:
○ Class Performance Compared to National
○ Class Average RIT
○ Class Median Achievement Percentile
– The Detailed NWEA Report section offers a View Report button; clicking this opens he NWEA platform in a separate browser window and shows your complete NWEA report.

(See MAP Help Center: Start
Page Overview ![]() for further details.)
for further details.)
– In the Raw scores table area (at the bottom of the page), do any of the following:
○ View the class test results in a table format; use the vertical scroll bar at the bottom to view all the columns of the table. The first table displayed is the most recent test. If previous test data exists, click Next to view the previous test results.
○ Click a table header to sort the table according to that column. (Some of the columns do not offer a sorting option.)
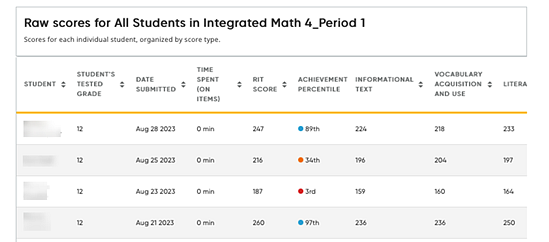
4. Use the buttons at the top of the page to print the report or export a CSV file of the report. (See Print or Export Growth Reports for details.)
5. To view an individual student's report, select the student from the Student list. The Growth Report page updates to display the MAP Growth Report for Individual Student, specifically for the selected student and test and highlights the student's position in the charts.
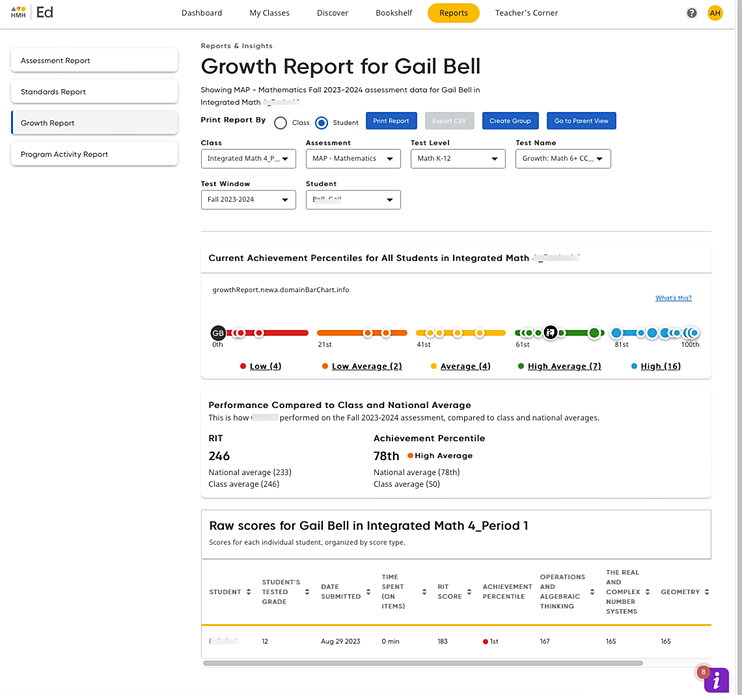
6. On the Growth Report for Individual Student page, do any of the following:
– Use the buttons at the top of the page to print the report or export a CSV file of the report. (See Print or Export Growth Reports for details.)
– Click the Go to Parent View button to view the student report with the class comparison data removed. This provides a report with only the selected student's data displayed, which allows you to save or print a report that is appropriate to share with parents.
➔ To return to the individual student report with class comparisons displayed, click the Go to Teacher View button.
– View the student's test results, including the selected test scores, proficiency rating, total year-to-date growth (which shows the growth of the most recent tests scores from the scores of the first test of the year), and if available, the state forecasted proficiency.
– In
the Current Achievement Percentiles for
All Students scatter plot, note the student's score, which is represented
by the node with the student's initials, compared to the class score.
The class average score is represented on the graph by the large black
and white node ![]() .
.
– In the Compare to Averages section, view the student's RIT and Achievement Percentile scores compared to class and national averages.
– In the Raw scores table, see the student's test results for all the test events offered for this test.
Note: NWEA MAP Growth Measure assessments do not allow you to review student responses.
See Also: