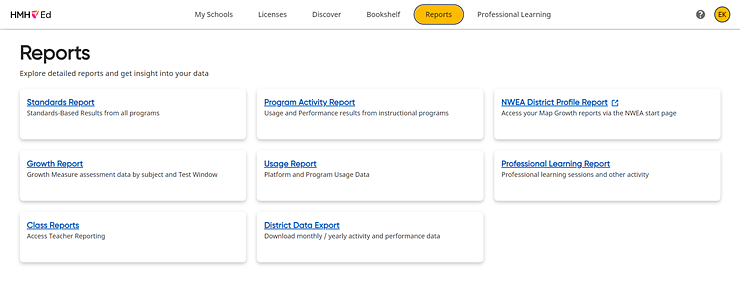
The Growth Reports for school and district leaders organizes student results from HMH Growth Measure assessments around their assigned class to show aggregate data in and across schools while also supporting the ability to then drill-down to class and student details. All Growth Reports provide comparisons, such as the change in a student's score from one test to another and the difference between the student scores and the end-of-year state testing performance levels for each score group. The Growth Measure assessment scores appear as HMH Scaled Score for Growth Measure Reading and Math.
Note: ● The maximum class size for Growth Reports is 400 students; to view data for a class size larger than 400, you can export a district-wide Growth Report using the District Data Exports option or you can view a Class Report. (For details, see Export District Growth Measure & Usage Reports or Open Class Reports.) ● If your organization does not have access to any of the growth measure learning programs, such as Into Reading, Into Literature, Into Math, Into AGA, Math in Focus, ¡Arriba la Lectura!, Waggle, Math 180, and Reading 180, then the growth reports are not available to you. ● Reports for the school years 2021–2022 and 2022–2023 show five performance levels (Far Below Level, Below Level, Approaching, On Level, and Above Level). ● At this time, reports for the school year 2020–2021 continue to show three performance levels (Below Level, Approaching/On Level, and Above Level). ● Reports from the 2019–2020 school year continue to show the previously offered performance levels (Below Basic, Basic, Proficient, and Advanced). ● If changes have been made to class rosters, those changes may take up to 72 hours to be reflected in the reports. ● Once a student completes a test, the new test scores may take up to 24 hours to be available in the reports. ● If a class does not have a grade level associated with it, that class does not appear in reports. You must add a grade level to the class for it to appear in the reports. (See View and Edit Class Information for details.) ● If no teacher is assigned to a class, the teacher column in the report displays as “Unassigned.” If you add a teacher to the class, the report updates to reflect the teacher's name. (See View and Edit Class Information for details.) ● The Growth Report for All Students (class report) and the Growth Report for Individual Student are available for reports starting with the 2020–2021 school year and beyond and only for HMH Growth Measure Math and HMH Growth Measure Reading assessments. These reports are available for Spanish Reading Growth Measure assessments starting with the 2023–2024 school year. |
1. In the banner, click the Reports tab, and on the Report page, click the Growth Reports card.

The default report that you see differs depending on your role, as follows:
– If you are a district administrator, the Growth Report for your organization appears, showing the Scaled Scores results of all tests across all grade levels in the district. The top of the page shows a bar chart for the most recent test event.
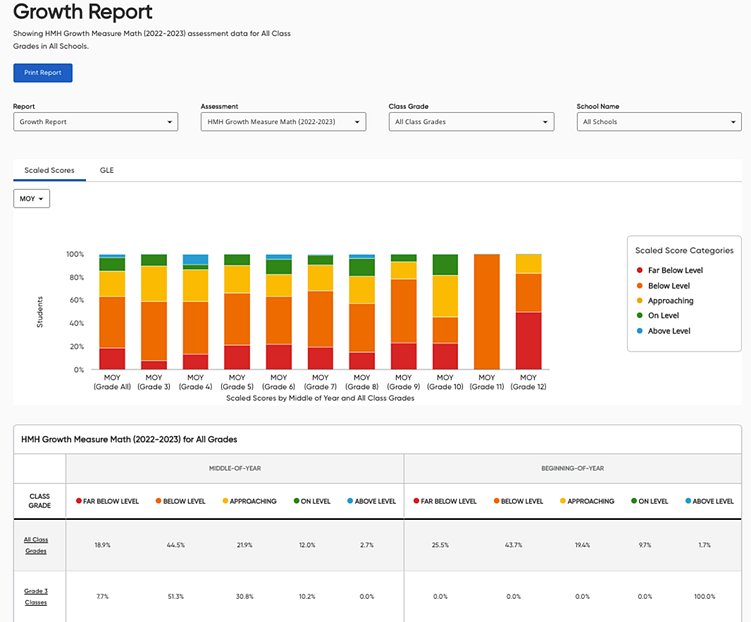
– If you are a school administrator and your organization has growth measure data for the selected subject, the Growth Report appears. The report shows the Scaled Scores results of all tests across all the grade levels and classes in their school. The top of the page shows a bar chart for the most recent test event.
Note: In the
table, below the chart, the most recent test event appears to the left,
and older assessments appear to the right. For growth measure assessment,
only a maximum of 3 test events can occur within any given school year.
 Click to view details
about test windows.
2. Use the lists above the report to filter selections and change the data displayed in the report, as follows:

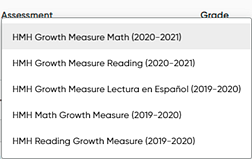
– Assessment – Select from the list of the growth assessments. Note that the list is arranged with the most recent tests at the top; the school year for the test appears after the assessment name.
– Class Grade – Select the class grade level of the growth assessment.
– School Name – Select the school from the list of schools in your district. (Available for district administrators only)
The bar chart and table update to reflect your selections.
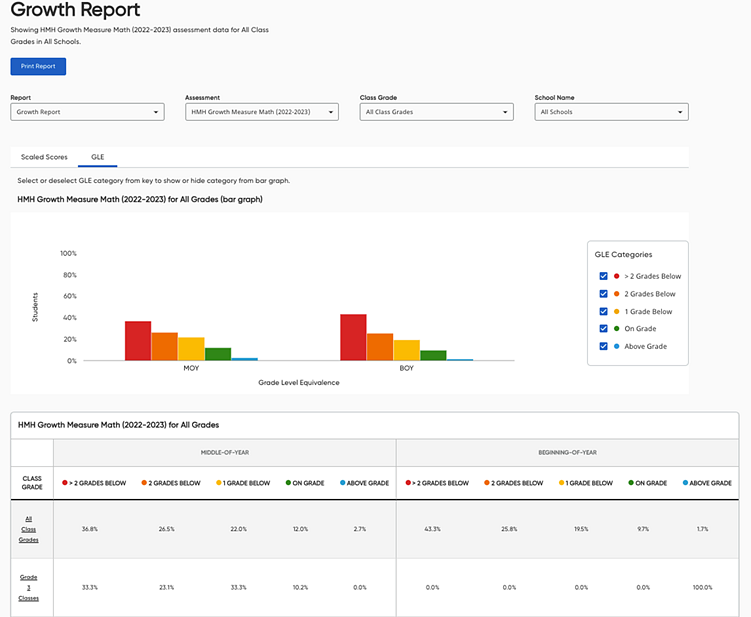
3. Select a tab to view the report using Scaled Scores or GLE (Grade Level Equivalent). The Scaled Scores tab is the default. The differences between the Scaled Scores and GLE are noted as follows:
The GLE view uses the same class grade structure as the Scaled Scores, which provides consistency in the class grades, school counts, student counts, and enrolled students. The only difference is the GLE view organizes student scores by the five GLE categories (>2 Grade Levels Below, 2 Grade Levels Below, 1 Grade Levels Below, On Grade Level, and Above Grade Level) and the Scaled Scores view uses the performance level categories (Far Below Level, Below Level, Approaching, On Level, and Above Level).
The GLE is a corresponding metric to the scaled score in that it shows how far away a student is from end-of-year grade level expectations at the time of the test. The scaled score represents where the students are in terms of readiness to learn grade level content; the GLE can also represent growth within a performance level towards end-of-year expectations.
The "Far Below" Performance Level category includes scaled scores from G01 to G20, while the">2 Grade Levels Below" GLE category includes scaled scores into the G20s to about G29 and makes up about a third of the "Below Level" performance level; this is why the count of students and associated percentage of students in the ">2 Grade Levels Below" GLE category will always have more students than the "Far Below" scaled score based performance level. As district and school administrators, be sure to take these differences into consideration when using the Growth Measure as part of your RTI/MTSS screening/eligibility workflows, especially when evaluating your most risk students, and then use the metrics with which you are most comfortable.
4. Note the various options in the bar charts:
– As you make selections to the report lists across the top (Assessment, Class Grade, or School), the bar chart and table change to reflect these changes.
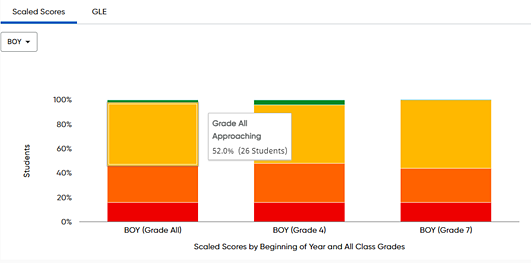
– By default, the Scaled Scores bar chart displays results across all grade levels in the district for the most recent test event; within this bar chart, you can do the following:
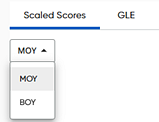
○ Change the time of year displayed in the chart using the list provided (BOY, beginning of year; MOY, middle of year; EOY, end of year), depending on how many test events have occurred.
○ Display the details of any scaled scores category by hovering or clicking within the bar chart.
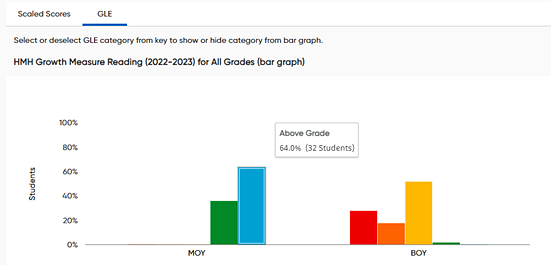
– By default, the GLE (Grade Level Equivalent) bar chart displays all test events that have occurred for the “all class grades”; within this bar chart, you can hover or click to display the details of any GLE category.
5. In the table, view more details about your report or open a different version of your selected report using the links within the report, as follows:
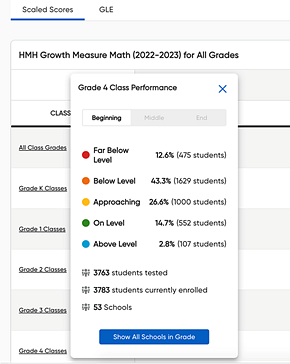
– For district administrators, click a report link (grade, school, or class) in the first column of the report table to view a summary box that displays results for that selection, including the number of students in each performance level, the number of students who have taken the test out of the total students enrolled in the district, and the number of schools that have used the growth measure and are included in this aggregation.
In the example below, the user clicked Scaled Scores tab and then clicked the Grade 4 link to display a summary of assessment results for all Grade 4 within the organization for the current testing period.
In this next example, the user clicked GLE tab and then clicked the Grade 4 link to display a summary of assessment results for all Grade 4 within the organization for the current testing period.
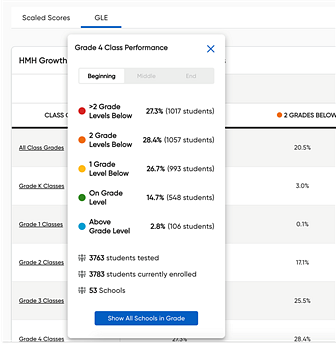
In this dialog box, do any of the following:
○ If available, click a time-of-year tab at the top of the box (Beginning, Middle, End) to view the summary for that time-of-year assessment.
○ Click the Show All Schools in Grade button within the summary box to view the complete report for the selected school, grade, or class. In this example, clicking the button opens a complete report showing the Reading Growth Measure results for Grade 4 for all schools within the district, which provides grade-level comparisons across all schools.
– For
school administrators, click a class name link within the report to view
a summary box that displays the proficiency results for that class, including
the number of students who are in each performance level, the number of
students who have taken the test out of the total students enrolled in
the school, and the number of classes that have used the growth measure
and are included in this aggregation.  Click
to view.
6. On the Growth Report for a selected grade (grade-level report for all schools), view the breakdown growth measure data by school and then click a school link to view a report summary of the results for each school.
In the example below, the user clicked a school link to display a summary of assessment results for Grade 4 Growth Measure Reading Beginning-of-Year assessment, which includes 2 classes with a total of 6 students enrolled and 6 students tested at this level for the selected school.
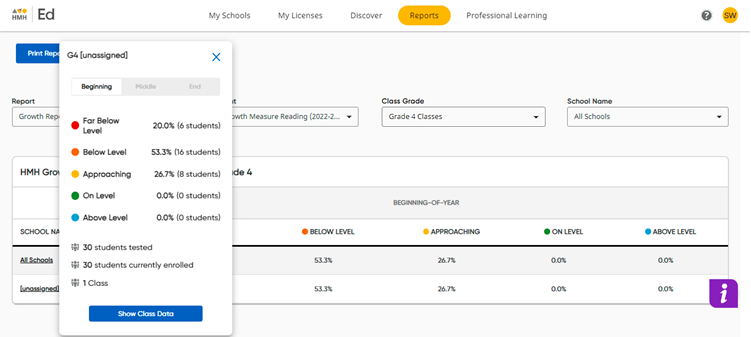
In this dialog box, do any of the following:
– If available, click a time-of-year tab at the top of the box (Beginning, Middle, End) to view the summary for that time-of-year assessment.
– Click the Show Class Data button within the summary box to view the complete report for the selected school's class report. In this example, it shows a complete report showing the Math Growth Measure results for Grade 2 classes within this school.
This opens the Growth Report shown in the example below allowing comparisons of classes of the same class or grade level within the same school.
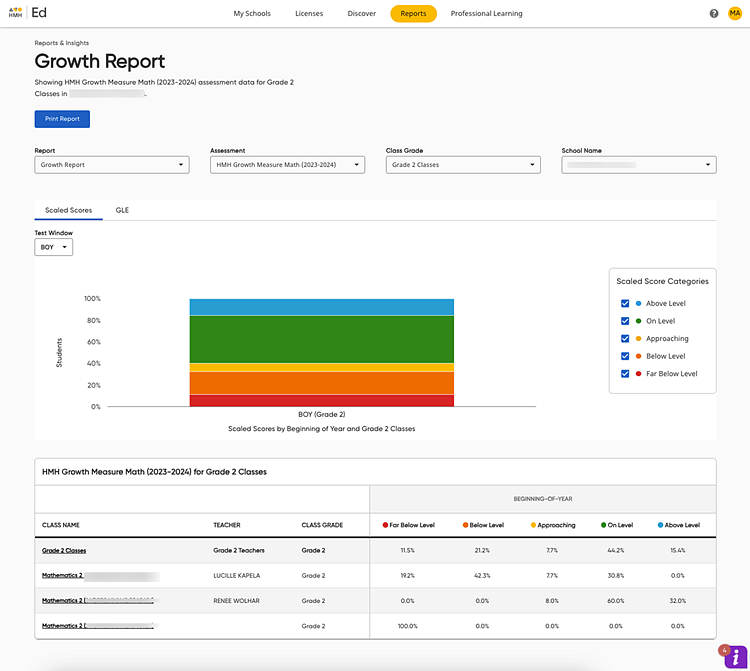
– In the dialog box, click the Show Student Data button within the summary box to view the complete report for all students within the selected class.
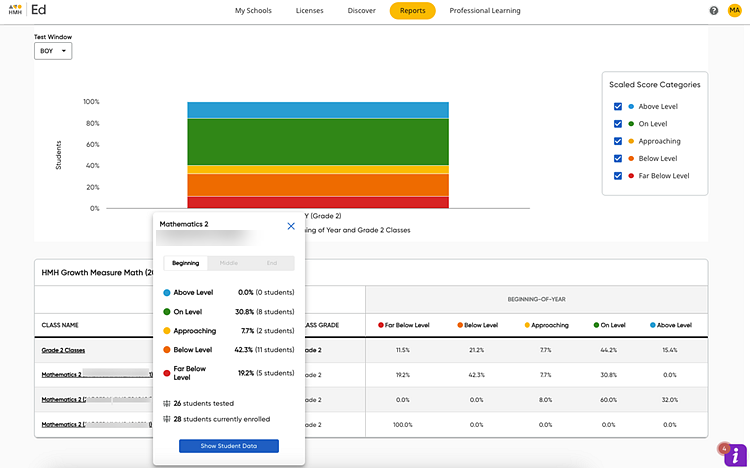
Note: This option is only available for reports starting with the 2020–2021 school year and beyond and only for HMH Growth Measure Math and HMH Growth Measure Reading assessments. These reports are available for Spanish Reading Growth Measure assessments starting with the 2023–2024 school year.
The example below shows the Growth Report for All Students, which displays Growth Measure Reading assessment results for the most recent test (Beginning-of-Year) for all the students within Class 2.
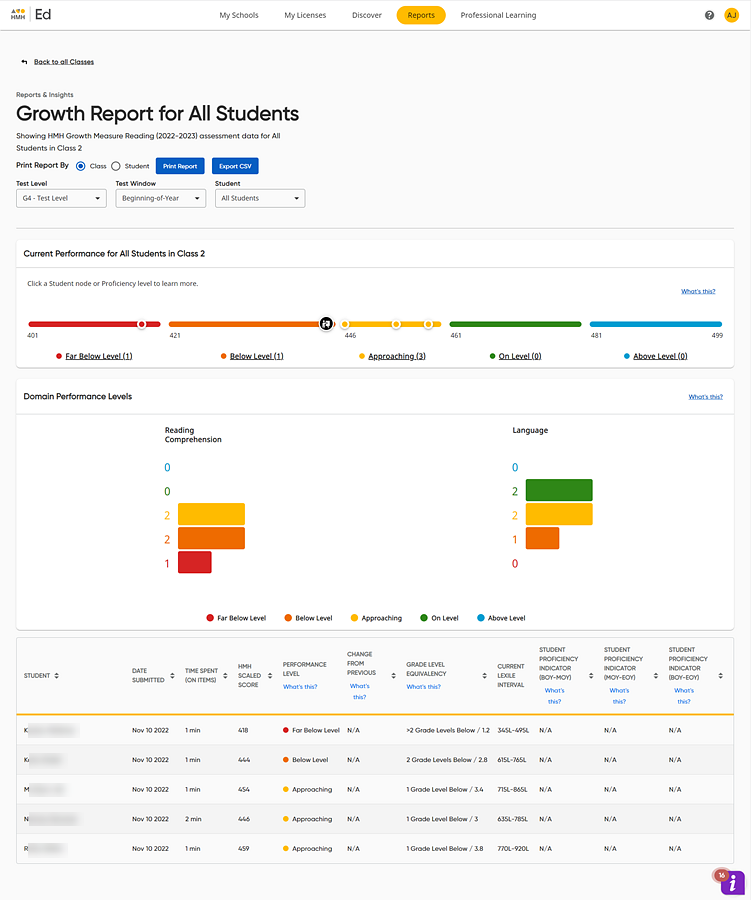
7. On the Growth Report for All Students (specific class report for the selected school), do any of the following:
– Use the buttons at the top of the page to print the report or export a CSV file of the report. (See Print or Export Growth Reports for details.)
– In
the Current Performance scatter
plot, click in any color band to view the list of students whose Scaled
Score fall within that score range; the test score for each student is
also displayed. The average class score is indicated by the large black
and white node ![]() .
.
– In the Domain Performance Levels bar graph, view the break down in your class test performance by the skill domains and see how many students in your class are performing above level, on level, approaching, below level, and far below level for each domain. Click any bar to view the list of students whose scores fall within that score range.
– Scroll to the table area to see the class test results in a table format. The first table displayed is the most recent test. If previous test data exists, click Next to view the previous test results. Click a table header to sort the table according to that column. (Some of the columns do not offer a sorting option.)
– Click the Back to all Classes link at the top of the page to return to the previous report page showing all the classes within the selected school.
8. To view an individual student's report, select the student from the Reports for list. The Growth Report page updates to display the Growth Report for Individual Student, specifically for the selected student and test.
Note: The Growth Report for Individual Student is only available for reports starting with the 2020–2021 school year and beyond and only for HMH Growth Measure Math and HMH Growth Measure Reading assessments (not available for Lectura en Español assessments).
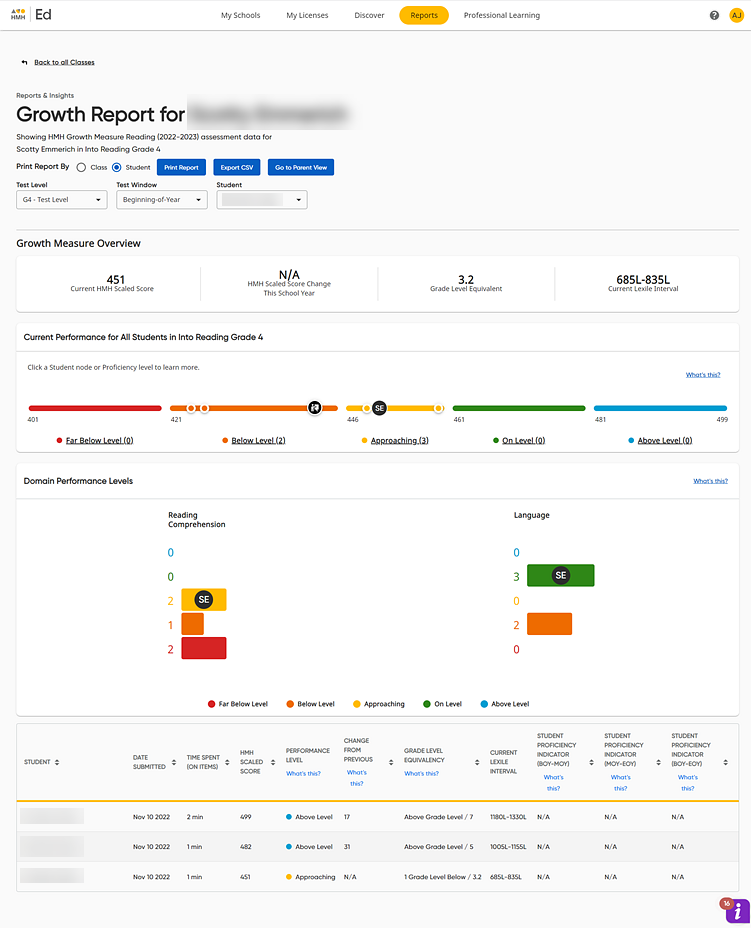
9. On the Growth Report for Individual Student page, do any of the following:
– Use the buttons at the top of the page to print the report or export a CSV file of the report. (See Print or Export Growth Reports for details.)
– Click
the Go to Parent
View button to view the student report with the class comparison
data removed. This provides a report with only the selected student's
data displayed, which allows you to save or print a report that is appropriate
to share with parents.  Click
to view example of a Parent View report page.
➔ To return to the individual student report with class comparisons displayed, click the Go to Teacher View button.
– View the student's test results, including the selected test scores, proficiency rating, total year-to-date growth (which shows the growth of the most recent tests scores from the scores of the first test of the year), and if available, the state forecasted proficiency.
– In
the Current Performance scatter
plot, note the student's score, which is represented by the node with
the student's initials, compared to the class score. The class average
score is represented on the graph by the large black and white node ![]() .
.
– In the Domain Performance Levels graph, view the student's performance for each domain. Click any bar to view the list of students whose scores fall within that score range.
– In the table, see the student's test results for all the test events offered for this test.
– Click the Back to all Classes link at the top of the page to return to the previous report page showing all the classes within the selected school.
See also:
Set Growth Measure Testing Schedules
Navigate the Growth Report Pages
Print or Export Growth Reports