HMH Growth Measure Reports show class and student results from growth measure assessments. All Growth Measure Reports provide comparisons, such as the change in a student's score from one test to another and the difference between the student scores and the end-of-year state testing performance levels for each score group. The growth measure assessment scores appear as Scaled Scores.
Note: ● If your organization does not have access to any of the growth measure learning programs, such as Into Reading, Into Literature, Into Math, Into AGA, Math in Focus, ¡Arriba la Lectura!, Waggle, Math 180, and Read 180, then the growth reports are not available to you. ● Reports for the school years 2021–2022 and 2022–2023 show five performance levels (Far Below Level, Below Level, Approaching, On Level, and Above Level). ● At this time, reports for the school year 2020–2021 continue to show three performance levels (Below Level, Approaching/On Level, and Above Level). ● Reports from the 2019–2020 school year continue to show the previously offered performance levels (Below Basic, Basic, Proficient, and Advanced). |
1. Do either of the following:
– In the Your Messages area of the Dashboard, locate the Growth Report Update message for the growth measure you want to open and click View Report.

Note: This message appears on your Dashboard when at least one student has completed an assigned growth measure assessment.
Or
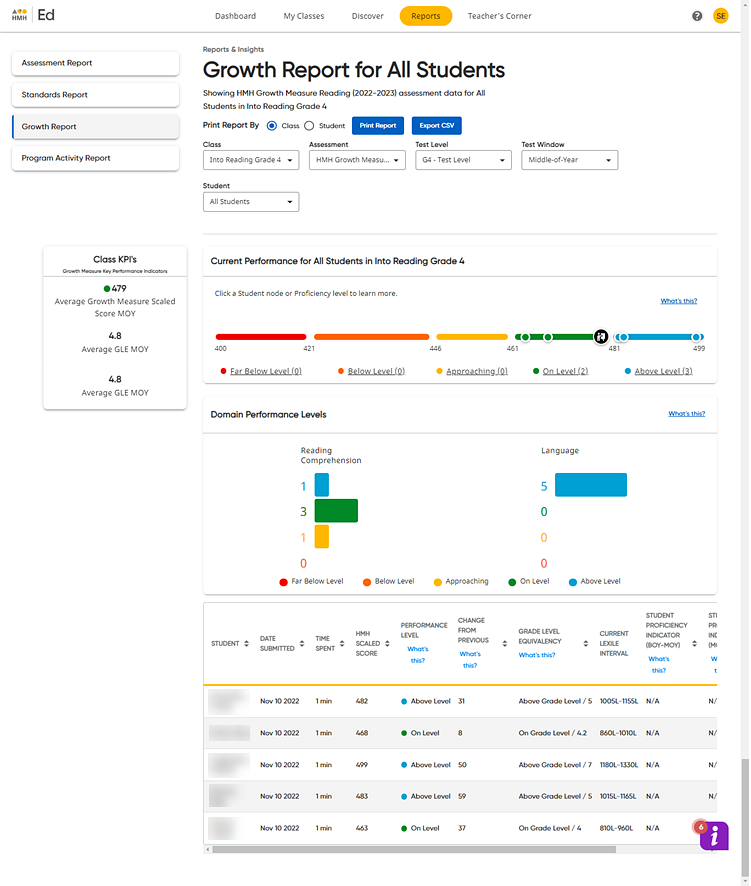
– In the banner, click the Reports tab, and then in the left panel of the page, click Growth Report. The Growth Report page appears. By default, the report shows the class report (All Students) for the most recent test in the selected subject.
Note: The report page is blank until at least one student in the selected class has completed the growth measure assessment.

Note: The Class Key Performance Indicator (KPI) widget in the left panel of the page provides a quick view of the class average scaled score and the class average grade level equivalency (GLE) for the report; this widget remains in place as you scroll down the report page.
2. Above the report graphs, use the lists provided to select the report that you want to view, as follows:
– In the Class list, select the class.
– In the Assessment list, select the test title and school year.
– In the Test Level list, select another level of the test (if available).
– In the Test Window list, select the test window of the test (Beginning-of-Year, Middle-of-Year, or End-of-Year).
– In the Student list, select an individual student for which to view the report. (Skip to step 5 for details.)
3. Use the buttons at the top of the page to print the report or export a CSV file of the report. (See Print or Export Growth Reports for details.)
4. On the Growth Report for All Students (class report), note the three areas of the report.
– In the Current Performance for All Students scatter plot, do any of the following:
○ Note
the average class score, which is indicated by the large black and white
node ![]() .
.
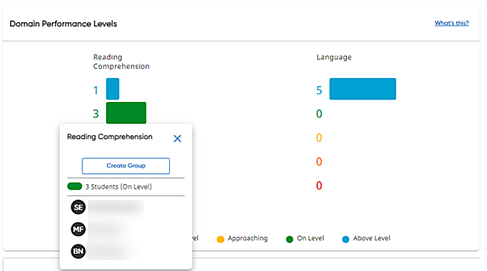
○ Click a color band link (below the graph) to view a dialog box listing the students whose HMH Scaled Scores fall within that score range; the test score for each student is also displayed.

○ Within
the dialog box, click Create Group
to create a group of the students listed in this performance level. The
Create Groups page appears with
the listed students in a group named for the performance level (for example,
"On Level").  Click
to view example of Create Groups page.
The Create Groups page displays the other students in the class and allows you to create additional groups. For details about renaming and managing groups, see Edit Groups.
– In the Domain Performance Levels bar graph, do any of the following:
○ View the break down in your class test performance by the skill domains and see how many students in your class are performing Above Level, Approaching, On Level, Below Level, and Far Below Level for each domain.
○ Click any bar to view a dialog box listing the students whose scores fall within that score range.

○ Within
the dialog box, click Create Group
to create a group of the students listed in this domain performance level.
The Create Groups page appears
with the listed students in a group named for the domain performance level
(for example, "On Level") and a description of groups named
for the domain (for example, "Reading Comprehension").  Click
to view example of Create Groups page.
The Create Groups page displays the other students in the class and allows you to create additional groups. For details about renaming and managing groups, see Edit Groups.
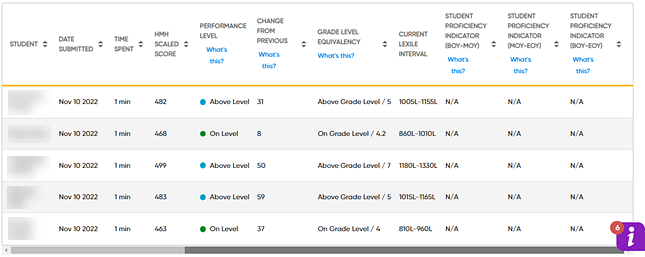
– In the table area (at the bottom of the page), do any of the following:
○ View the class test results in a table format; use the vertical scroll bar at the bottom to view all the columns of the table. The first table displayed is the most recent test. If previous test data exists, click Next to view the previous test results.
○ Click a table header to sort the table according to that column. (Some of the columns do not offer a sorting option.)

Note: Each Growth Report can have up to three tests in a school year.
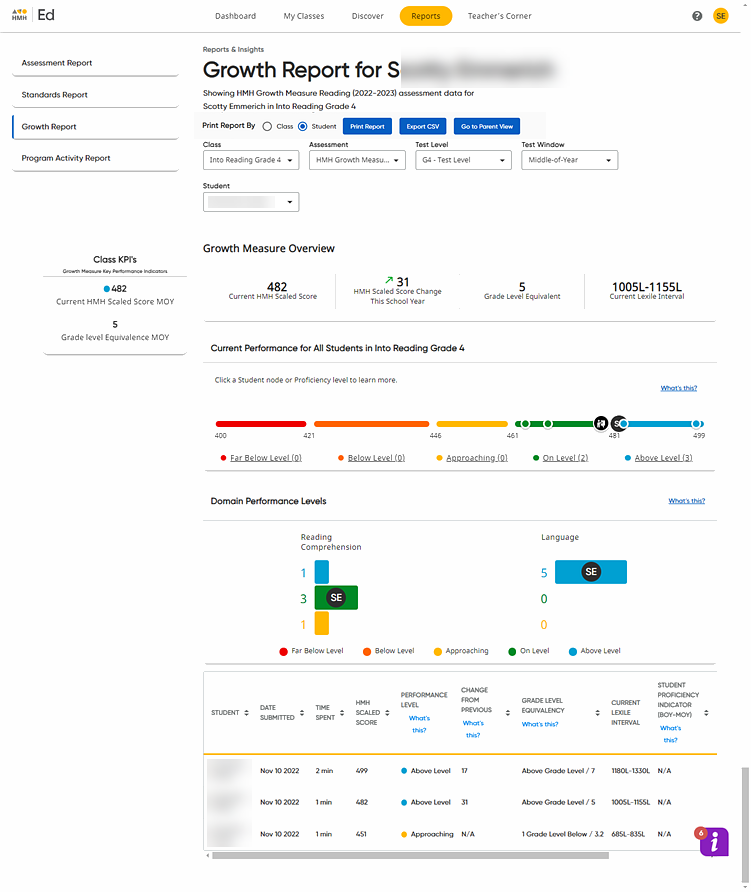
5. To view an individual student's report, select the student from the Student list. The Growth Report page updates to display the Growth Report for Individual Student, specifically for the selected student and test and highlights the student's position in the charts.

Note: The Key Performance Indicator (KPI) widget in the left panel of the page provides a quick view of the student's average scaled score and student's average grade level equivalency (GLE) for the report; this widget remains in place for you to review as you scroll down the report page.
6. On the Growth Report for Individual Student page, do any of the following:
– Use the buttons at the top of the page to print the report or export a CSV file of the report. (See Print or Export Growth Reports for details.)
– Click
the Go to Parent
View button to view the student report with the class comparison
data removed. This provides a report with only the selected student's
data displayed, which allows you to save or print a report that is appropriate
to share with parents.  Click
to view example of a Parent View report page.
➔ To return to the individual student report with class comparisons displayed, click the Go to Teacher View button.
– View the student's test results, including the selected test scores, proficiency rating, total year-to-date growth (which shows the growth of the most recent tests scores from the scores of the first test of the year), and if available, the state forecasted proficiency.
– In
the Current Performance scatter
plot, note the student's score, which is represented by the node with
the student's initials ![]() , compared
to the class score. The class average score is represented on the graph
by the large black and white node
, compared
to the class score. The class average score is represented on the graph
by the large black and white node ![]() .
.
– In the Domain Performance Levels graph, view the student's performance for each domain. Click any bar to view the list of students whose scores fall within that score range.
– In the table, see the student's test results for all the test events offered for this test.
Note: Unlike other assessments and activities, Growth Measure assessments do not allow you to review student responses.
 Click here to view instructions specific
to opening a Renaissance Star Growth Report
See Also:
Growth Measure Assessment Types
Growth Measure Scores and Metrics