
The Reports page provides an easy-to-use layout to help you navigate and view assessment, standards, growth measure, and instructional practice report data. Open reports by clicking the Reports tab. The Assessment Report page opens by default. You can then click a link on the left side of the page to open the Standards Report, Growth Report, or Program Activity Report.
Details of the Standards Report page are provided below.
➔ Click a letter or outlined area to view Standards Report page details.
Report Links and Report Information |
|||
Report Links Allow you to select the report type to view. |
 |
||
Report Information Provides details about the selected report, including the dates, the standard set, grade level, program, and assessment type of the data being displayed.
|
|||
Customize, Export and Print Buttons / Class, Subject, and Student Lists |
|||
|
Customize This Report Button
Note the following about customizing reports: – The Assessment Report defaults to show all grade levels where data exists in a standard set. In many instances, the student data from a class covers multiple grade levels. The reasons for this can be any of the following:
○ The Growth Measure covers at least one grade level above, on grade level, and at a minimum two grade levels below the actual grade level of the test.
○ Many Into Math and Reading classrooms have multiple grade levels of the curriculum available to them in their classrooms.
○ Math 180’s mSkills assessments may also cover more than one grade level of standards.
In most state and national standards sets, the domains are often the same across multiple grade levels making it hard to determine which grade level of the standards is being shown. To focus on the grade level standards in which you are most interested, you can customize the report to a specific Standard Set and Grade Level. This grade level is noted on each domain within the report.
– The Program list defaults to All Programs for the selected subject. If available, specific programs are listed (Into Math, Growth Measure, Math 180, Into Literature, Read 180, Into Reading, and so on), allowing a more granular view into student performance on the specific program.
– Assessment Type(s) defaults to All Types (Interactive Weekly, Module Assessments, and so on). The list of assessments varies, depending on the selected program and subject; for example, Waggle ELA (for Reading and Language Arts) and Waggle Math offer Practice as an assessment type, which allows you to isolate Waggle Practice as the only standards-based data in the report
– Period reflects the time period for which data is included in the report; the default Period is All Dates.
○ All Dates includes all data that exists for the selected class; if your class names change each school term, the All Dates period allows you to see all the data for the term period of the selected class. ○ School Year '21/'22 includes data from July 1, 2021 to June 30, 2022. ○ Custom date range allows you to set your own time period by entering the From Date and the To Date. ○ School year to date includes data from the current school year from July 1 to June 30. |
||
|
Export PDF Button Allows you to export the standards reports as a portable document format (PDF) file. For details, see Print or Export Standards Reports for details. |
||
Print Button Allows you to print the standards report as it appears on this page. For details, see Print or Export Standards Reports for details. |
|||
Class List Offers a list of all your classes.
|
Subject List Provides a list of all the subject areas to which your HMH programs are associated.
|
Student List Allows you to select a student for which to view the standards report.
|
|
Standard Proficiency Domain Cards |
|||
|
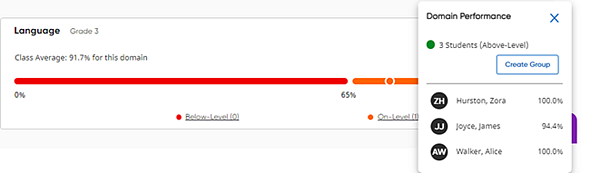
Displays students' average scores for each domain in the selected standard set. Note the following details: ● Each standard set consists of multiple domains, which are listed in individual cards on the Standards Report page. However, only domains for which data exists are displayed. ● For each domain, a graph shows the selected student's proficiency score as well as the scores of the other students in the class displayed in color-coded ranges. ● A student's average proficiency score for each domain is calculated based on all the assessment items (across all assessments) the student has taken that are assessing standards within that particular domain. ➔ In each domain card, you can do either of the following: – Click a score range to view individual student scores for that level.
– In the Domain Performance or Standard Performance dialog boxes, click the Create Group button to automatically create a group consisting of the students listed in the dialog box. The group is saved under the name of the domain or standard and the associated performance level and can then be selected when assigning appropriate content. Note: When you create assignments, your groups are available in the Create Assignment dialog box. If needed, you can edit group names, as well as add, move, and remove students from groups; see Edit Groups for details.
– In
the upper right corner of each domain card, click the
Note the following about the Domain Performance by Standard page: ○ For
each detailed standard, a scatter plot shows the average proficiency
score of the class, represented by a large black and white node
○ The average scores of each student in the class is represented on the graph by an individual node displayed in color-coded ranges. If you select an individual student by which for view the page, the selected student's average score is represented by a node with the student's initials. ○ In any detailed standard card, click a color band link (below the graph) to view the list of students whose scores fall within that score range.
○ In the Domain Performance or Standard Performance dialog boxes, click the Create Group button to automatically create a group consisting of the students listed in the dialog box. The group is saved under the name of the domain or standard and the associated performance level and can then be selected when assigning appropriate content. Note: When you create assignments, your groups are available in the Create Assignment dialog box. If needed, you can edit group names, as well as add, move, and remove students from groups; see Edit Groups for details.
○ In
the upper right corner of a detailed standard card, click the
○ Click
the |
||
See Also:
Print or Export (PDF) Standards Reports
Navigate the Assessment Reports Page


 Allows
you to customize the Assessment Reports based on
Allows
you to customize the Assessment Reports based on 


 link to view the resources that are aligned
to this standard. The
link to view the resources that are aligned
to this standard. The 